How Systems Like Netflix Prevent Cascading Failures
Learn how circuit breakers stop cascading microservice failures with timeouts, fallback responses, half-open probes, and recovery tuning.
Why this matters
In a microservice architecture, a single degraded service can take down your entire platform. Consider an e-commerce checkout flow: the API gateway calls an order service, which calls a payment service, which calls a fraud detection service. When the fraud service starts responding in 12 seconds instead of 200ms, every thread in the payment service blocks waiting. Within 90 seconds, the payment service’s thread pool (typically 200 threads) is completely exhausted.
Now the order service starts timing out on payments. Its threads block too. The cascade propagates upstream until the API gateway itself becomes unresponsive. Your monitoring dashboard lights up: p99 latency spikes from 400ms to 30,000ms, error rates jump to 60%, and your on-call engineer’s phone starts buzzing at 3 AM.
Netflix experienced exactly this pattern in their early microservice migration. A single underperforming backend service caused a site-wide outage affecting millions of users. Their response was Hystrix — the open-source circuit breaker library that became the gold standard for resilience patterns. The core insight: it’s better to fail fast and return a degraded response than to let threads pile up waiting for a service that isn’t coming back.
Practical note Circuit breakers are not there to make a broken dependency healthy. They are there to keep the rest of the system from waiting politely while it fails.
The mental model
A circuit breaker wraps every outbound service call and operates as a state machine with three states: Closed, Open, and Half-Open.
In the Closed state, all requests pass through to the downstream service normally. The breaker maintains a counter of consecutive failures. When a request fails (timeout, 5xx response, connection refused), the counter increments. When a request succeeds, the counter resets to zero. Once the consecutive failure count reaches the configured failure threshold (e.g., 5 failures), the circuit trips to Open.
In the Open state, the breaker short-circuits immediately. No requests reach the downstream service — they are rejected in under 1ms with a fallback response (cached data, default values, or an error message). A timeout countdown begins.
This is the critical protection mechanism: instead of 200 threads blocking for 30 seconds each, the breaker rejects requests instantly, preserving thread pool capacity for healthy service calls.
When the timeout expires, the circuit transitions to Half-Open. A limited number of probe requests are allowed through to test if the downstream service has recovered. If enough probes succeed (the probe success count), the circuit closes and normal traffic resumes. If any probe fails, the circuit snaps back to Open with a fresh timeout, preventing premature traffic restoration.
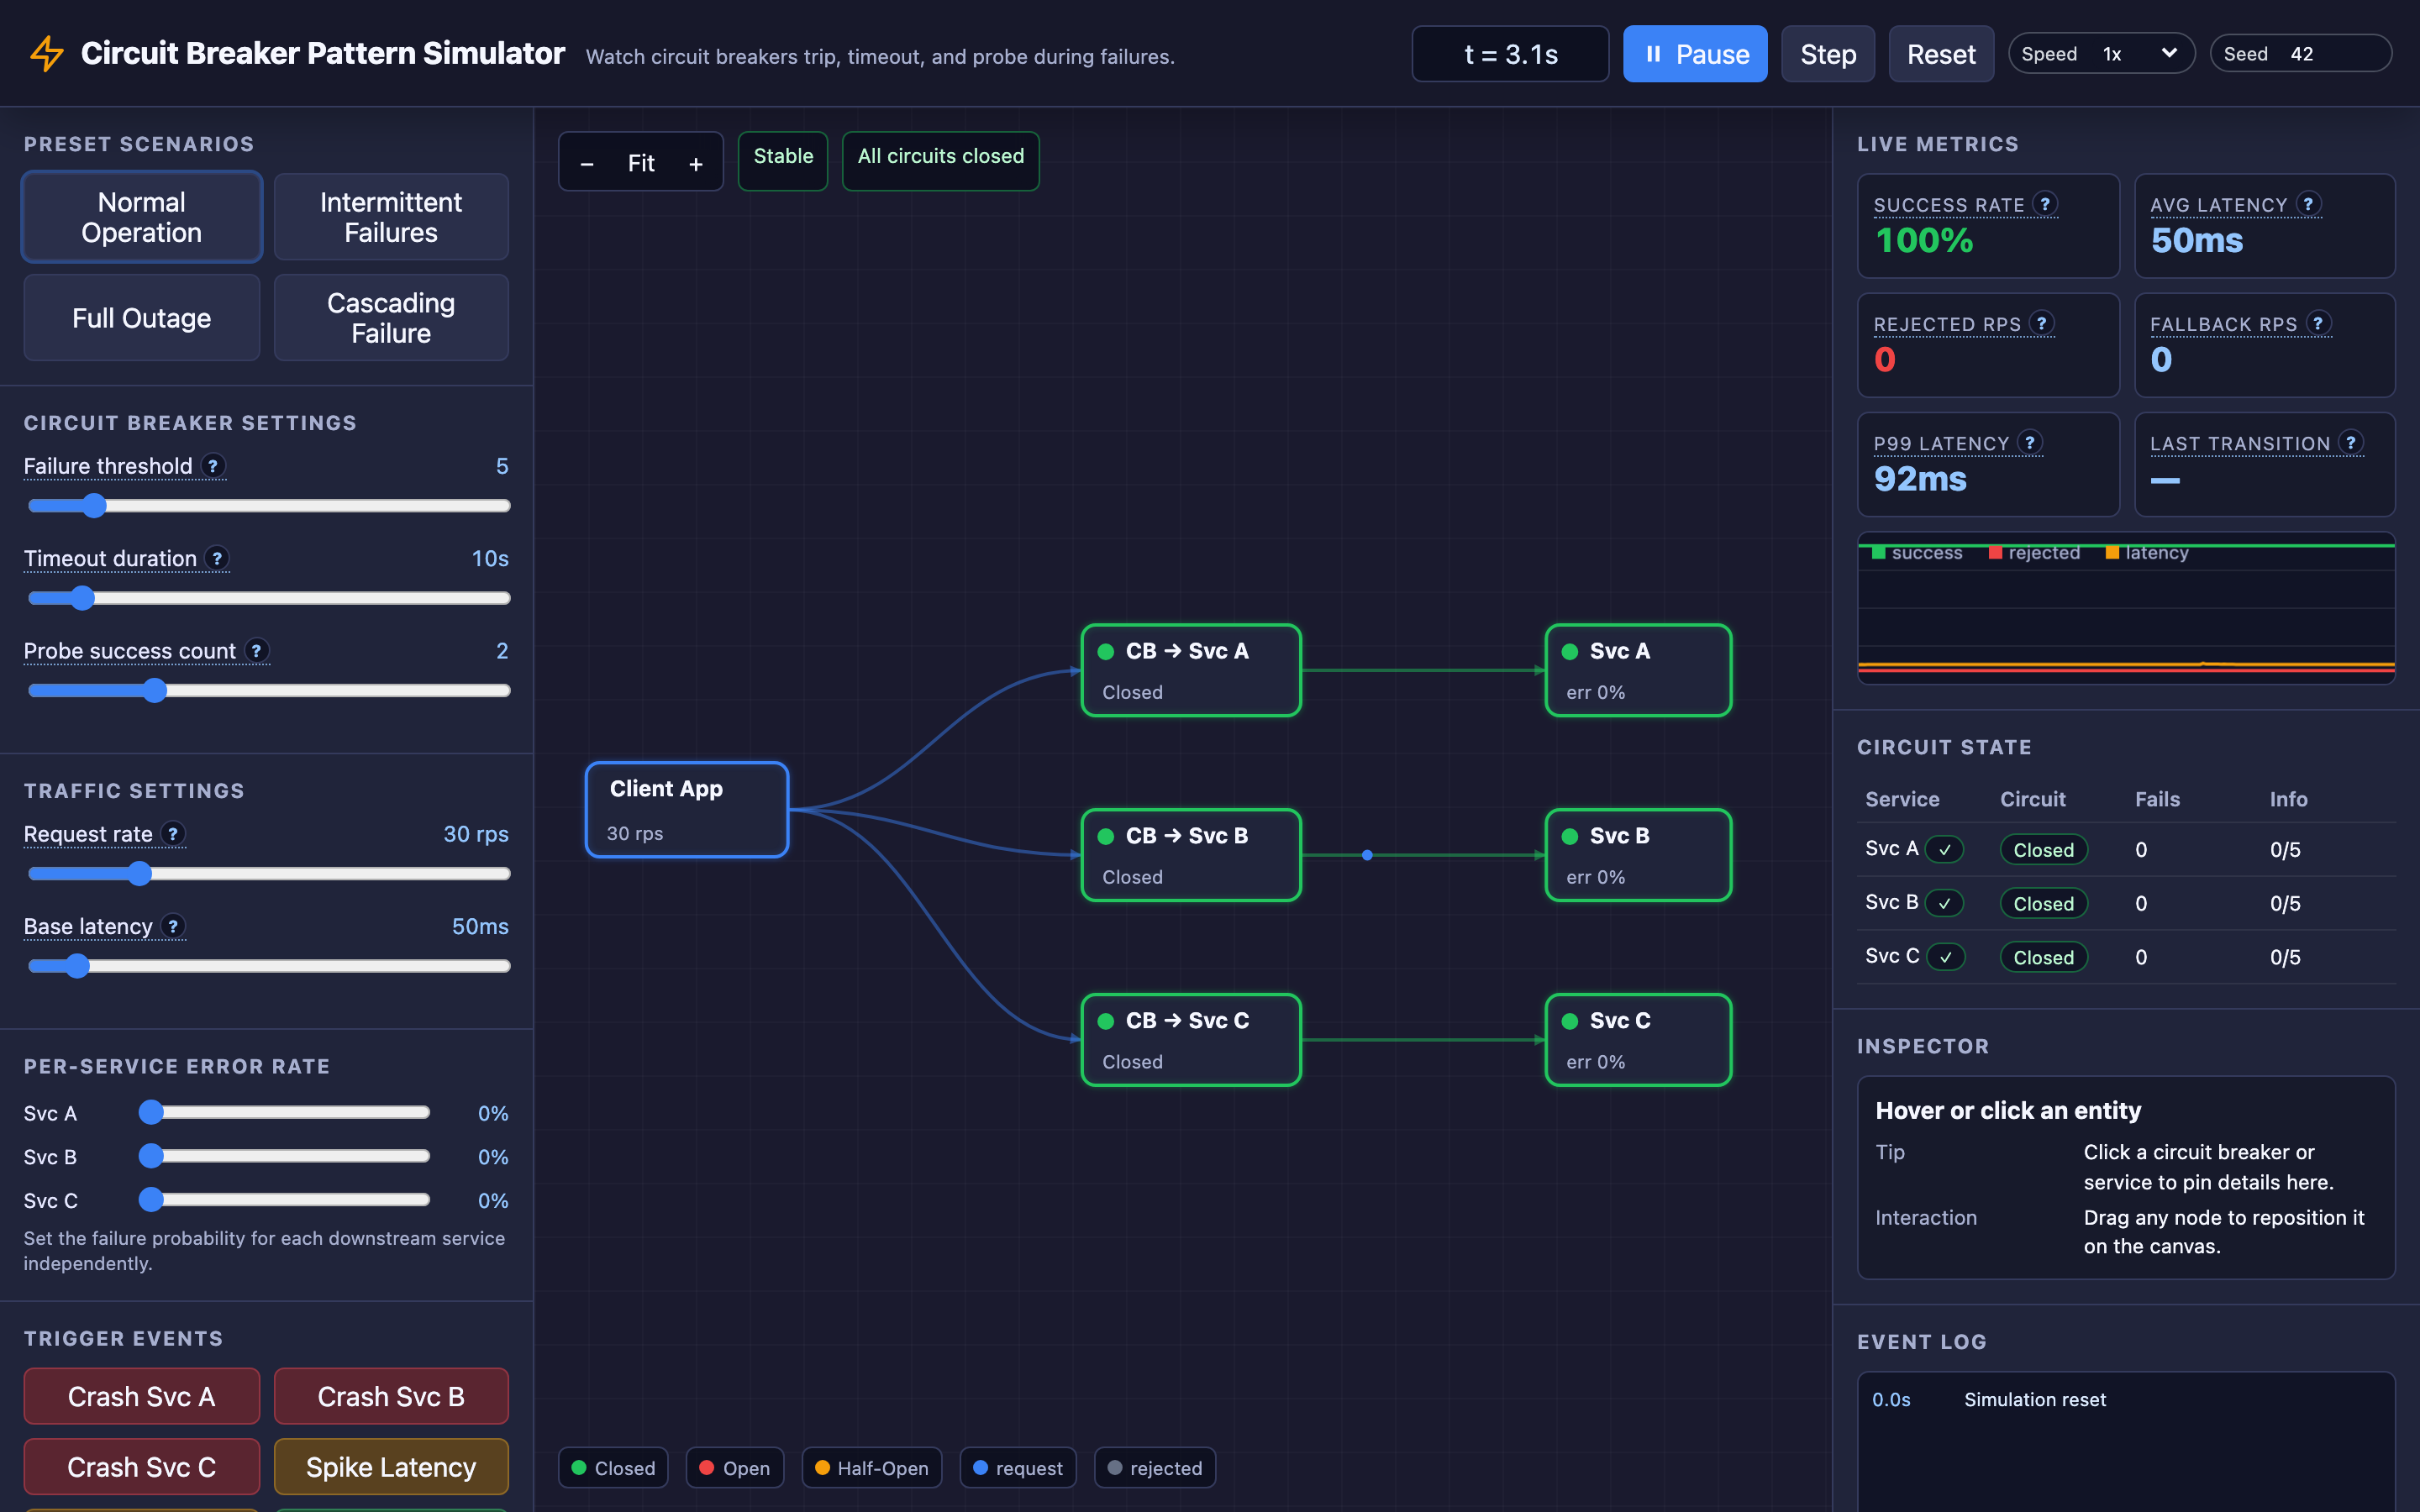
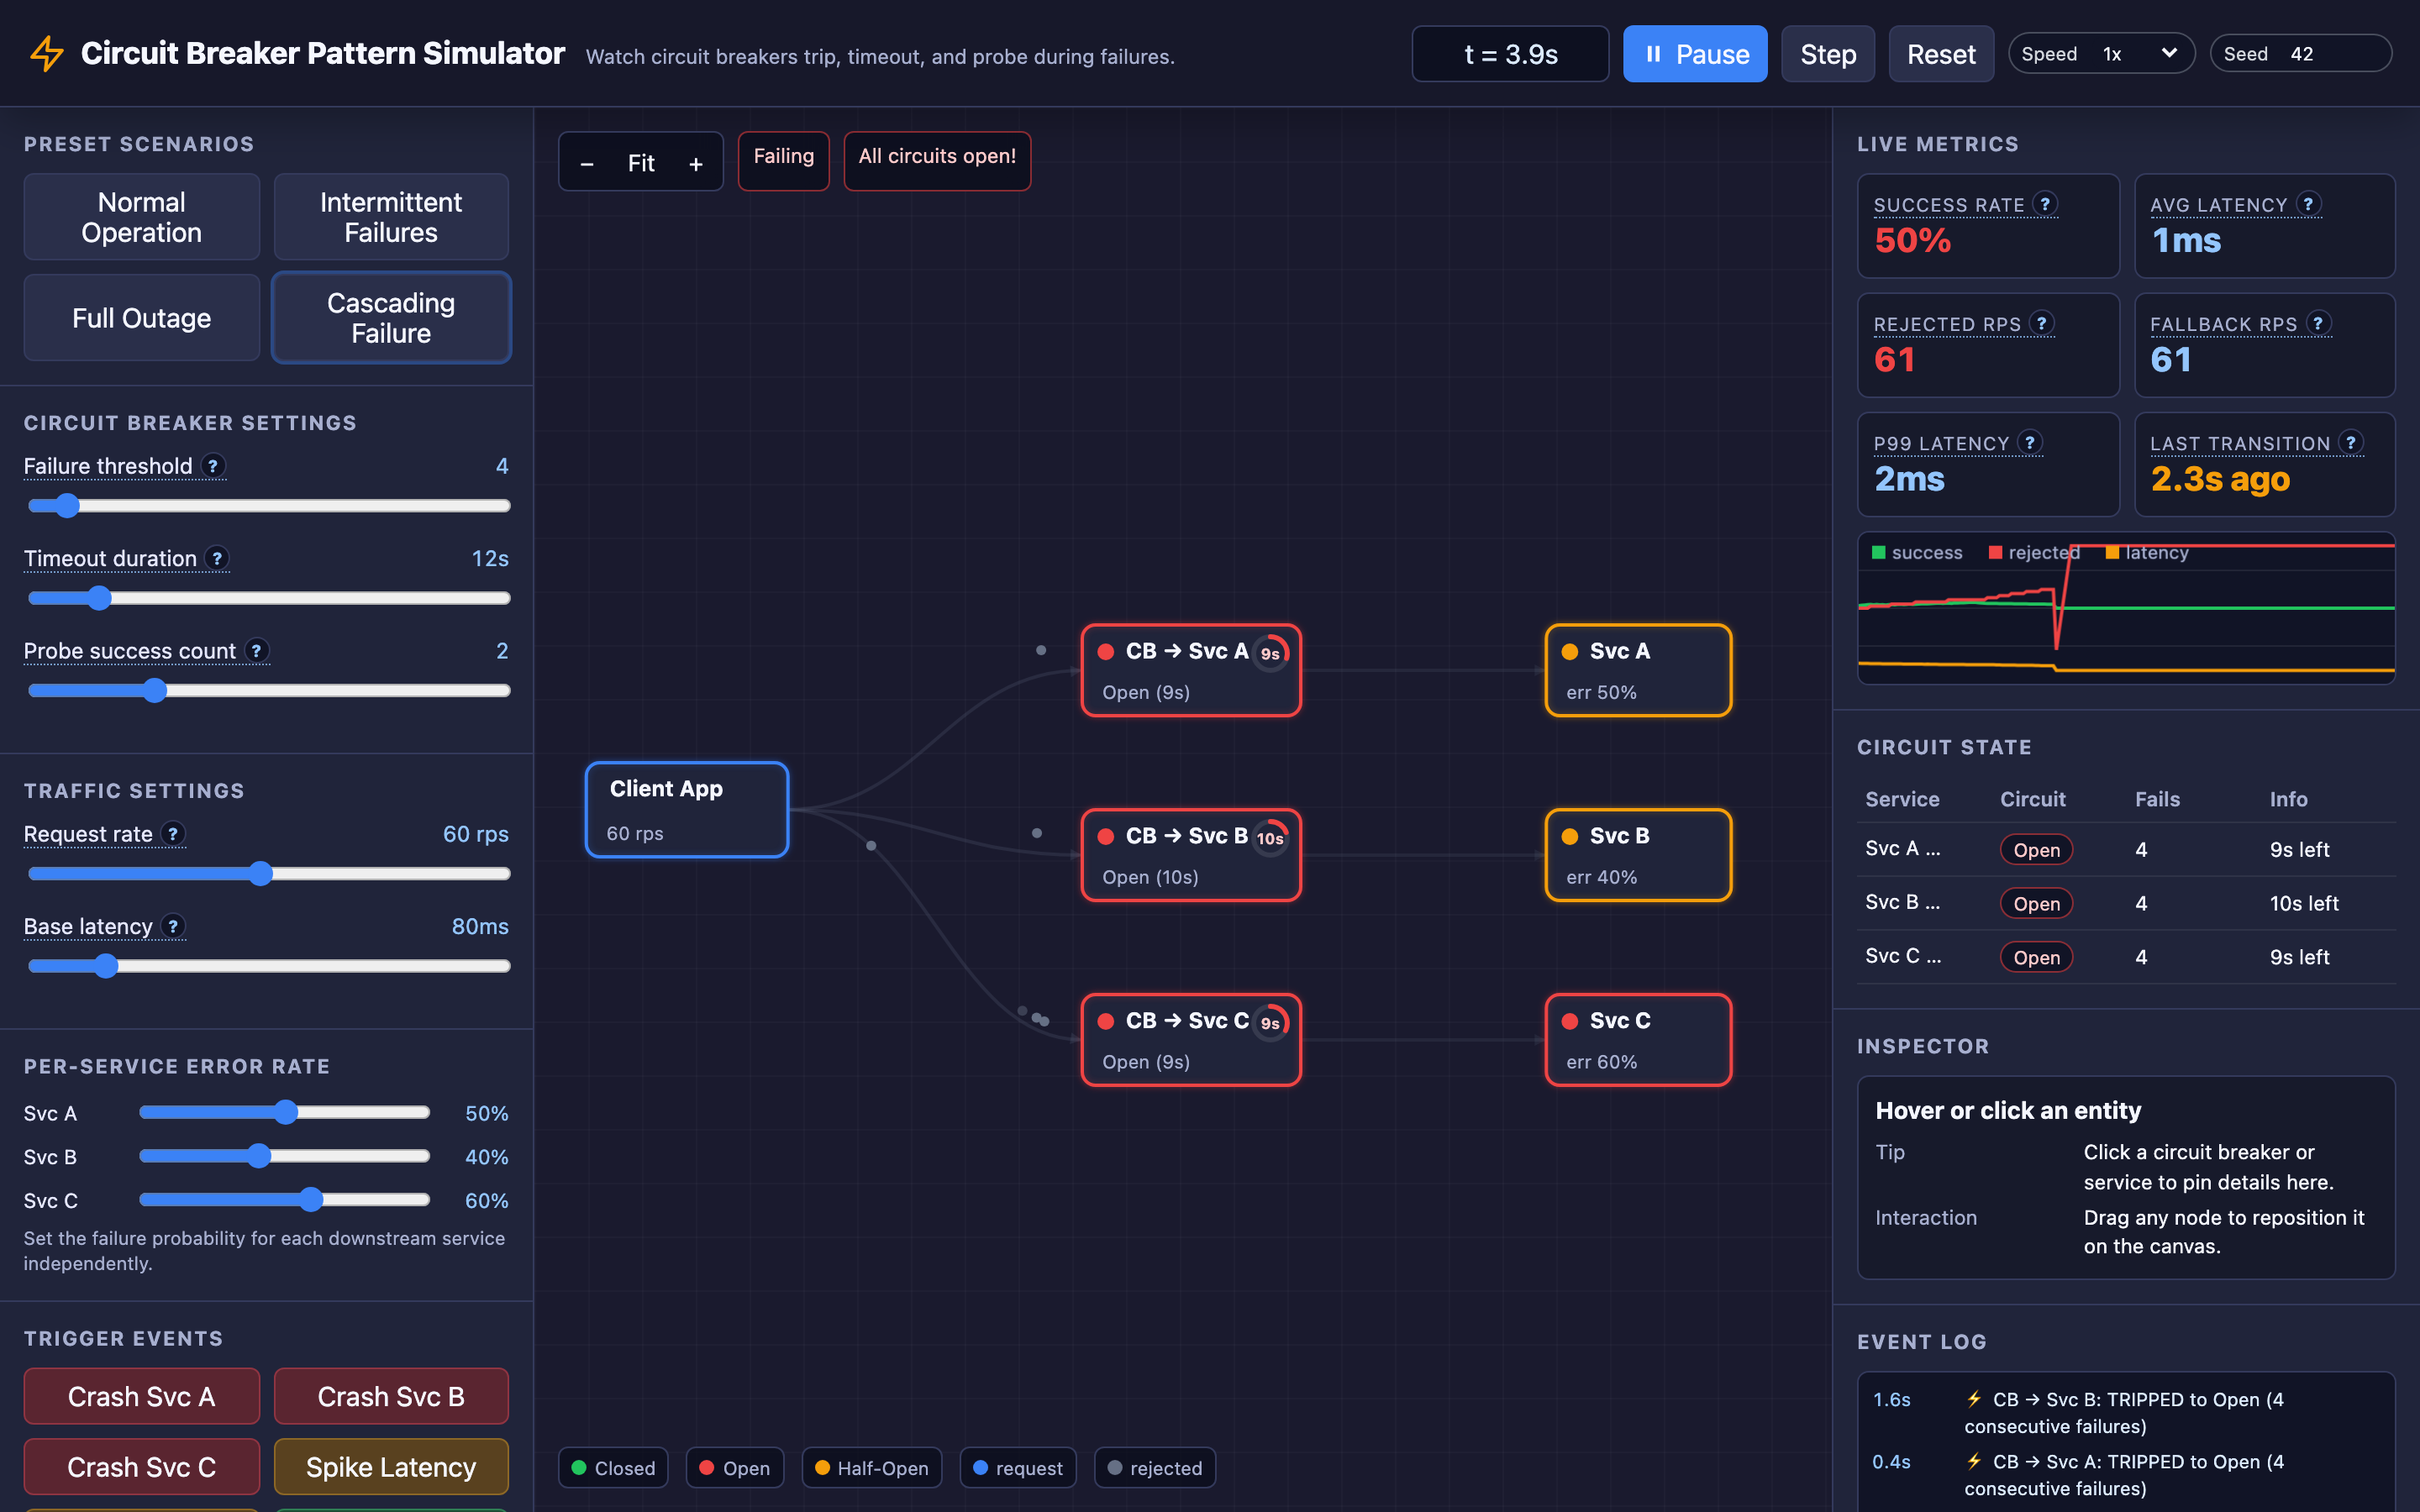
Each downstream service gets its own independent circuit breaker. In the TechViz simulator, the client app sends requests across three services, each with independent error rates, latency multipliers, and crash states — mirroring how real systems isolate failure domains.
Decisions that matter
Failure Threshold (Range: 3–20)
The number of consecutive failures required to trip the circuit from Closed to Open. At the low extreme (3), the breaker is hair-trigger sensitive — three back-to-back timeouts and traffic is cut. At the high extreme (20), the system absorbs significant damage before reacting. Most production systems use 5–10.
# Resilience4j configuration example
resilience4j.circuitbreaker:
  instances:
    paymentService:
      failureRateThreshold: 50
      slidingWindowSize: 10
      minimumNumberOfCalls: 5
Timeout Duration (Range: 5–60 seconds)
How long the circuit remains Open before transitioning to Half-Open for recovery probing. Set this too low (5s) and you’ll hammer a recovering service with probe requests before it’s ready. Set it too high (60s) and you’re serving degraded responses for a full minute even after the downstream service recovers in 10 seconds.
Probe Success Count (Range: 1–5)
The number of successful probe requests needed in Half-Open to close the circuit. A count of 1 means a single successful response restores full traffic — risky if the downstream service is only intermittently healthy. A count of 5 provides higher confidence but extends the Half-Open window.
Request Rate (Range: 5–120 rps)
The volume of client traffic flowing through the breakers. At 120 rps with a failureThreshold of 5, the circuit trips in under 50ms of sustained failures. At 5 rps, it might take a full second. Higher request rates make breaker behavior more responsive but also more sensitive to transient blips.
Per-Service Error Rate (0–100%)
Each downstream service has an independent failure probability. This is the control that lets you model realistic scenarios: Service A at 30% errors (intermittent database issues), Service B at 0% (healthy), and Service C at 100% (complete outage). Real production environments almost never see uniform failure — it’s always one service degrading while others remain healthy.
Where it breaks: Misconfigured Timeouts — Threads Exhaust Before the Breaker Trips
The failure mode: The HTTP client timeout is set to 30 seconds, but the circuit breaker failureThreshold is 10. At 20 rps, each failing request holds a thread for 30 seconds before counting as a failure. To accumulate 10 consecutive failures, you need 10 × 30s = 300 seconds of thread-blocking time.
With a thread pool of 200, you’ve consumed 10 threads for 5 minutes — and if failures continue at 20 rps, you’ll exhaust all 200 threads in 5 minutes before the breaker ever trips.
Warning Setting HTTP client timeouts higher than the circuit breaker trip time means threads will exhaust the pool before the breaker trips. Always ensure
client_timeout × failureThreshold < acceptable_trip_time.
What you will notice:
- Thread pool utilization climbs steadily in Prometheus:
hikaricp_connections_activeapproacheshikaricp_connections_max p99latency grows linearly (not spiking — growing) as threads queue up- The circuit breaker state metric stays
CLOSEDeven as the service is clearly degraded kubectl top podsshows low CPU but high memory — threads are parked, not computing
What I would do: Align your HTTP client timeout with your breaker’s trip speed. If the failureThreshold is 5 and you want the breaker to trip within 10 seconds, set the client timeout to 2 seconds max. The formula: client_timeout × failureThreshold < acceptable_trip_time. In practice, Netflix recommends client timeouts of 1–2 seconds for inter-service calls.
Where it breaks: Flapping Between Open and Closed States
The failure mode: A downstream service is partially degraded — responding successfully 60% of the time but failing 40%. The failureThreshold is set to 3. Three consecutive failures trip the circuit to Open.
After the timeout (10 seconds), the breaker enters Half-Open with a probe success count of 1. The single probe succeeds (60% chance). The circuit closes. Within seconds, three more consecutive failures trip it Open again. This Open → Half-Open → Closed → Open cycle repeats every 15–20 seconds.
What you will notice:
- Circuit breaker state metric rapidly alternates between
OPENandCLOSEDin Grafana dashboards - Client-side error rates oscillate in a sawtooth pattern — 0% during Closed bursts, 100% during Open periods
- Downstream service receives traffic in unpredictable bursts rather than a steady stream, worsening its instability
- Logs show repeating patterns:
CircuitBreaker 'paymentService' changed from OPEN to HALF_OPENfollowed bychanged from CLOSED to OPENwithin seconds
What I would do: Increase the probe success count to 3–5 so that recovery requires sustained health, not a single lucky response. Implement exponential backoff on the timeout duration — first Open period is 10s, second is 20s, third is 40s. This gives the downstream service progressively more time to stabilize. Resilience4j supports this with waitDurationInOpenState and a multiplier.
Hint The interactive demo’s “Cascading Failure” preset demonstrates this scenario. Try setting the
failureThresholdto3and the probe success count to1to reproduce the flapping behavior.
Where it breaks: Fallback Failures Masking the Real Problem
The failure mode: The circuit breaker trips correctly and starts returning fallback responses — in this case, cached product recommendations from a Redis instance. But the Redis cache was populated 6 hours ago, and the cache TTL is 8 hours. The fallback returns stale data silently.
Worse, the cache eventually expires, and the fallback itself starts throwing CacheMissException. Now you have a cascading failure in the fallback path, and the user sees raw 500 errors instead of graceful degradation.
What you will notice:
- No alerts fire because the circuit breaker metrics show it’s working correctly (requests rejected, fallback invoked)
- Business metrics diverge from technical metrics — conversion rates drop because stale recommendations are irrelevant
- After cache TTL expiration, the
fallback_failure_totalcounter spikes in Prometheus - Application logs show
FallbackExecutionException: No cached data available for key=recommendations
What I would do: Implement layered fallbacks: primary fallback (fresh cache) → secondary fallback (stale cache with a staleness indicator) → tertiary fallback (static default response). Monitor fallback invocation rates independently.
Set alerts on circuit_breaker_fallback_total > 100/min to catch when fallbacks are carrying production load. Ensure cache TTLs for fallback data are significantly longer than the maximum expected outage duration.
The tradeoff
| Approach | Pros | Cons |
|---|---|---|
| Low failure threshold (3–5) | Fast trip time, protects threads quickly | False alarms on transient network blips, premature traffic cutoff |
| High failure threshold (10–20) | Tolerates transient errors, fewer false trips | Significant thread exhaustion before protection kicks in |
| Short timeout duration (5–10s) | Fast recovery when downstream heals | Hammers recovering services with premature probes |
| Long timeout duration (30–60s) | Gives downstream services time to fully recover | Extended degraded experience for users |
| Simple fallback (error message) | Easy to implement, no additional dependencies | Poor user experience, no graceful degradation |
| Complex fallback (cached data + defaults) | Seamless user experience during outages | Additional failure modes, stale data risks, higher maintenance |
| Consecutive failure counting | Simple implementation, predictable behavior | Doesn’t account for failure rate — 3 failures in 1000 requests trips the same as 3 in 3 |
| Sliding window failure rate | Accounts for traffic volume, percentage-based decisions | More complex, requires tuning window size and rate threshold |
A practical checklist
Step 1: Verify circuit breaker state in real-time. Query your metrics endpoint or Prometheus for the current state:
curl http://service:8080/actuator/circuitbreakers | jq '.circuitBreakers.paymentService.state'Step 2: Check failure counts and rates. Look at the sliding window metrics to understand whether trips are legitimate:
rate(resilience4j_circuitbreaker_failures_total[5m])Step 3: Correlate with downstream health. Verify the downstream service’s actual health — is it truly failing, or is the breaker misconfigured? Check downstream service metrics, health endpoints, and recent deployments.
Step 4: Review timeout alignment. Ensure client_timeout × failureThreshold is less than your acceptable degradation window. If your thread pool is 200 and your request rate is 50 rps, you exhaust threads in 4 seconds of full blocking — your breaker must trip faster than that.
Step 5: Validate fallback paths. Manually test fallback responses under circuit-open conditions. Confirm fallback data sources (caches, static responses) are populated and not expired.
Step 6: Set up circuit breaker dashboards. Build a Grafana dashboard showing all three states, transition events, fallback invocation rates, and downstream service health side by side. This is your single pane of glass during incidents.
Try it yourself
Reading about circuit breaker states is one thing — watching requests pile up, circuits trip, and fallbacks activate in real-time is another. The TechViz simulator lets you crash individual services, spike latency, burst traffic, and watch how different threshold and timeout configurations change the system’s resilience behavior.
Try the interactive Circuit Breaker demo → Experiment with the “Cascading Failure” preset to see what happens when all three services degrade simultaneously, then tune the failureThreshold and timeout duration to find the sweet spot.